


Have you ever attempted to analyze the internal data movement of a system and got lost halfway through? Actually, you are not the only one. Most of the systems do appear uncomplicated to users, but on the inside, there is an incessant flow of information among users, databases, and processes. This is precisely the instance where a data flow diagram comes into play.
A data flow diagram simplifies complex systems into something you can see and follow, indeed. Rather than going through the technical literature that is often very lengthy, you get direct views of how data is received by a system, its routes, and what happens to it. Thus, data flow diagrams are extensively used in software development, business analysis, and system planning.
We will take you through everything in this guide step by step. No presumptions. Only a straightforward interpretation of a data flow diagram, its operation, and how one can correctly draw one up as a beginner, to start with.
What Is the Data Flow Diagram?
Before we start discussing symbols or giving examples, let’s first clarify a very basic issue: What exactly is a data flow diagram?
A data flow diagram (DFD) can be defined as an illustration of data movement in a system. It indicates:
- Where data comes from
- How data is processed
- Where data is stored
- Where data goes next
Instead of focusing on code or technical implementation, a data flow diagram focuses on logic and movement. It answers questions like:
- Who provides the data?
- What happens to the data?
- Where is the data saved?
- Who receives the output?
Because of this, DFDs are often used early in system design. They help teams agree on how things should work before building anything.
Why Data Flow Diagrams Matter
Data flowchart diagrams are not just academic tools. They solve real problems.
First, they make systems easier to understand. A well-drawn diagram can explain in minutes what might take pages of documentation.
Second, communication gets better. Everyone involved, developers, analysts, managers, and even non-technical stakeholders, can see the same diagram and comprehend the situation.
Third, they assist in the early detection of issues. When data is visualized, it often happens that missing data, unnecessary steps, or unclear logic become obvious.
Thus, data flow design is crucial in the creation of dependable systems.
Key Components of a Data Flow Diagram
Every data flow diagram is built using a few core components. Once you understand these, reading or creating diagrams becomes much easier.
1. External Entities
External entities represent the origin or destination of data and are typically people, organizations, or other systems.
Among the sources are:
- Customers
- Payment gateways
- External databases
- Third-party applications
They are not part of the system but continuously communicate with it.
2. Processes
Data is changed by processes. They provide input, take an action, and yield output.
A process can:
- Validate a form
- Calculate totals
- Generate reports
- Store information
Processes are usually characterized by verbs, like “Process Order” or “Verify Login”.
3. Data Stores
Data stores are places where data is held. This can be a database, file, or any storage system.
This is where the database flow diagram concept overlaps with data flow diagrams. The difference is that DFDs show how data moves in and out, not how databases are structured internally.
4. Data Flows
Data flows indicate the transfer of information among entities, processes, and data stores. These are depicted using arrows and are also labelled with the nature of the data that is being transferred.
Workflow Diagram Symbols vs Data Flow Diagram Symbols
Novices generally confuse the workflow diagrammatic signs with those of the data flow diagrams. Though they look alike, they serve different purposes.
Workflow diagrams highlight the activities and their sequence. Therefore, the diagram will give the response “first, second and third?”
In contrast, data flow diagrams deal with the data flow throughout the system. They provide the answer, “Where does the data go and what happens to it?”
Getting this distinction right keeps one from confusing the concepts and makes diagrams easy to read.
Levels of Data Flow Diagrams
Data flow diagrams are generally produced in levels. Each level is more detailed than the previous one.
Context Diagram (Level 0)
This is the highest-level view. It shows the entire system as one process and highlights external entities and major data flows.
A context diagram is perfect for introductions and presentations.
Level 1 Diagram
Here, the main process is broken into smaller subprocesses. This level shows how different parts of the system interact internally.
Level 2 and Beyond
These diagrams continue breaking processes into more detail. Not every system needs this level, but complex applications often do.
Data Flow Diagram Example (Simple Scenario)
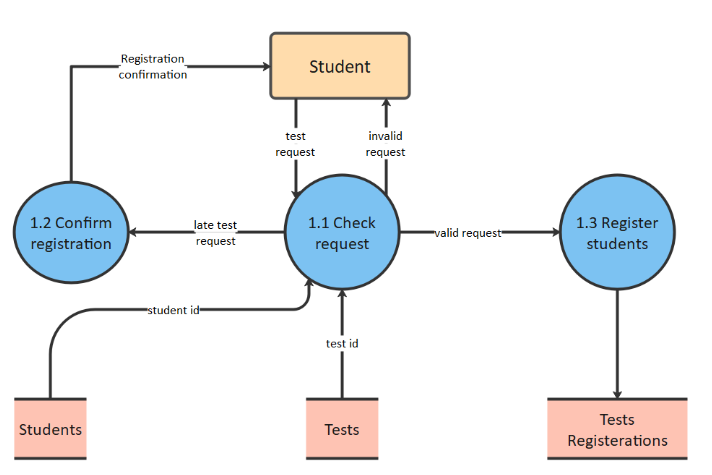
Let’s look at a simple data flow diagram example: an online contact form.
- A user submits a form (external entity)
- The system validates the input (process)
- The data is saved in a database (data store)
- A confirmation email is sent (process)
- The user receives confirmation (external entity)
This small example already shows how helpful a sample data flow diagram can be when explaining even simple systems.
Data Flow Model Diagram vs Flowcharts
A data flow model diagram focuses on data, not decisions or logic paths. Flowcharts show conditions and branching. DFDs show movement and transformation of data.
As a result, DFDs are usually combined with other diagrams rather than being used alone.
How to Create a Data Flow Diagram (Beginner-Friendly Steps)
If you are to draw your first diagram, opt for these steps:
- 1. Determine the system limits
- 2. Point out the outside actors
- 3. Enumerate the principal activities
- 4. Mark the data repositories
- 5. Link all with the data flow
- Review and simplify
The aim is to be clear, not to reach the highest level of perfection.
Common Mistakes Beginners Should Avoid
- Mixing workflow logic with data flow logic
- Adding too much detail too early
- Using inconsistent naming
- Forgetting data labels
- Making diagrams too crowded
It is always better to have a clean diagram than a complicated one.
Where Data Flow Diagrams Are Used Today
Data flow diagrams are applicable in various sectors:
- Software development
- Business process analysis
- System audits
- Data security planning
- Process optimization
Firms that provide both technical and analytical services usually depend on these diagrams in the early stages of planning.
Besides that, in several digital projects, groups come to depend on lucid data flow diagrams as a means to back up Digital Marketing Services, specifically when illustrating the transfer of user data across websites, analytics tools, CRMs, and reporting systems.
How Data Flow Diagrams Fit Into Modern Systems
Modern systems are really complicated. The APIs, cloud services, mobile apps, and databases are all active and involved at the same time. A data flow diagram helps make things clear, even as systems grow more complex.
When used alongside proper documentation and planning, DFDs minimize misunderstandings and boost teamwork.
To Conclude
A data flow diagram is not concerned with just creating boxes and arrows. The emphasis is on the understanding of the information flow and the justification for the particular flow.
After one gets used to the fundamentals, reading or making diagrams turns out to be natural. It doesn’t matter if you are a pupil, a researcher, or a company owner; the skill of interpreting data flow diagrams is an asset that is relevant to numerous sectors.
Start simple. Focus on clarity. And always think in terms of data movement.
Frequently Asked Questions (FAQs)
What are three types of DFD?
There are three common types of Data Flow Diagrams based on how detailed they are:
-A Level 0 DFD gives a high-level view of the whole system as one process.
-A Level 1 DFD breaks that system into main processes and shows data stores.
-A Level 2 DFD goes deeper by splitting processes into smaller sub-processes to explain the flow in more detail.
What is data flow in simple words?
Data flow can just be described as the path of data from one location to another. It indicates the origin of data, the operations performed on it, and the final destination of it. For instance, in the case of a user submitting a form, there is a data flow from the user to the system, then to a database, and finally again, but this time as the response.
What are the 4 components of DFD?
Every Data Flow Diagram is built using four basic parts.
-External entities send or receive data.
-Processes change or handles the data.
-Data stores hold the data for later use.
-Data flows show the direction and type of data moving between everything.
Why are DFDs used?
DFDs aid in presenting a very clear picture of data transmission between different parts of a system. They are a great help for the teams to get the process right, discover the gaps, and eliminate misunderstandings at an early stage. Since they deal with logic rather than the technicalities, they are very much applicable in the areas of planning, documentation, and system enhancement.